Every trader who is in a position has a stop loss somewhere. Every trader waiting for a breakout has an order waiting somewhere. Those orders are not on the chart, but they are real, and they sit in very predictable places. Together they are called liquidity.
Liquidity is resting orders: stop losses and pending entries that will trade the moment price reaches them. Where there are many of them close together, there is a pool of liquidity.
Where do they sit? Think about what a trader does. Someone who bought puts their stop loss below a recent low. Someone who sold puts their stop loss above a recent high. Breakout traders do the same thing in reverse: a buy order just above the high, a sell order just below the low. So the orders pile up in the same two places on every chart: just above old highs and just below old lows.
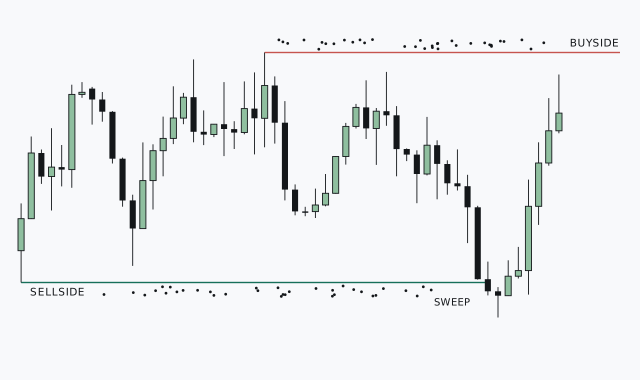
Buyside liquidity: the orders resting above a high. Stop losses from sellers and breakout buy orders. When price reaches them, they all buy.
Sellside liquidity: the orders resting below a low. Stop losses from buyers and breakout sell orders. When price reaches them, they all sell.
Why does this matter? Because big participants cannot fill large positions without a lot of orders on the other side, and the largest guaranteed cluster of orders is exactly there: above the high, below the low. So price is drawn to those places. An old high is not a wall that holds price back. It is a target.
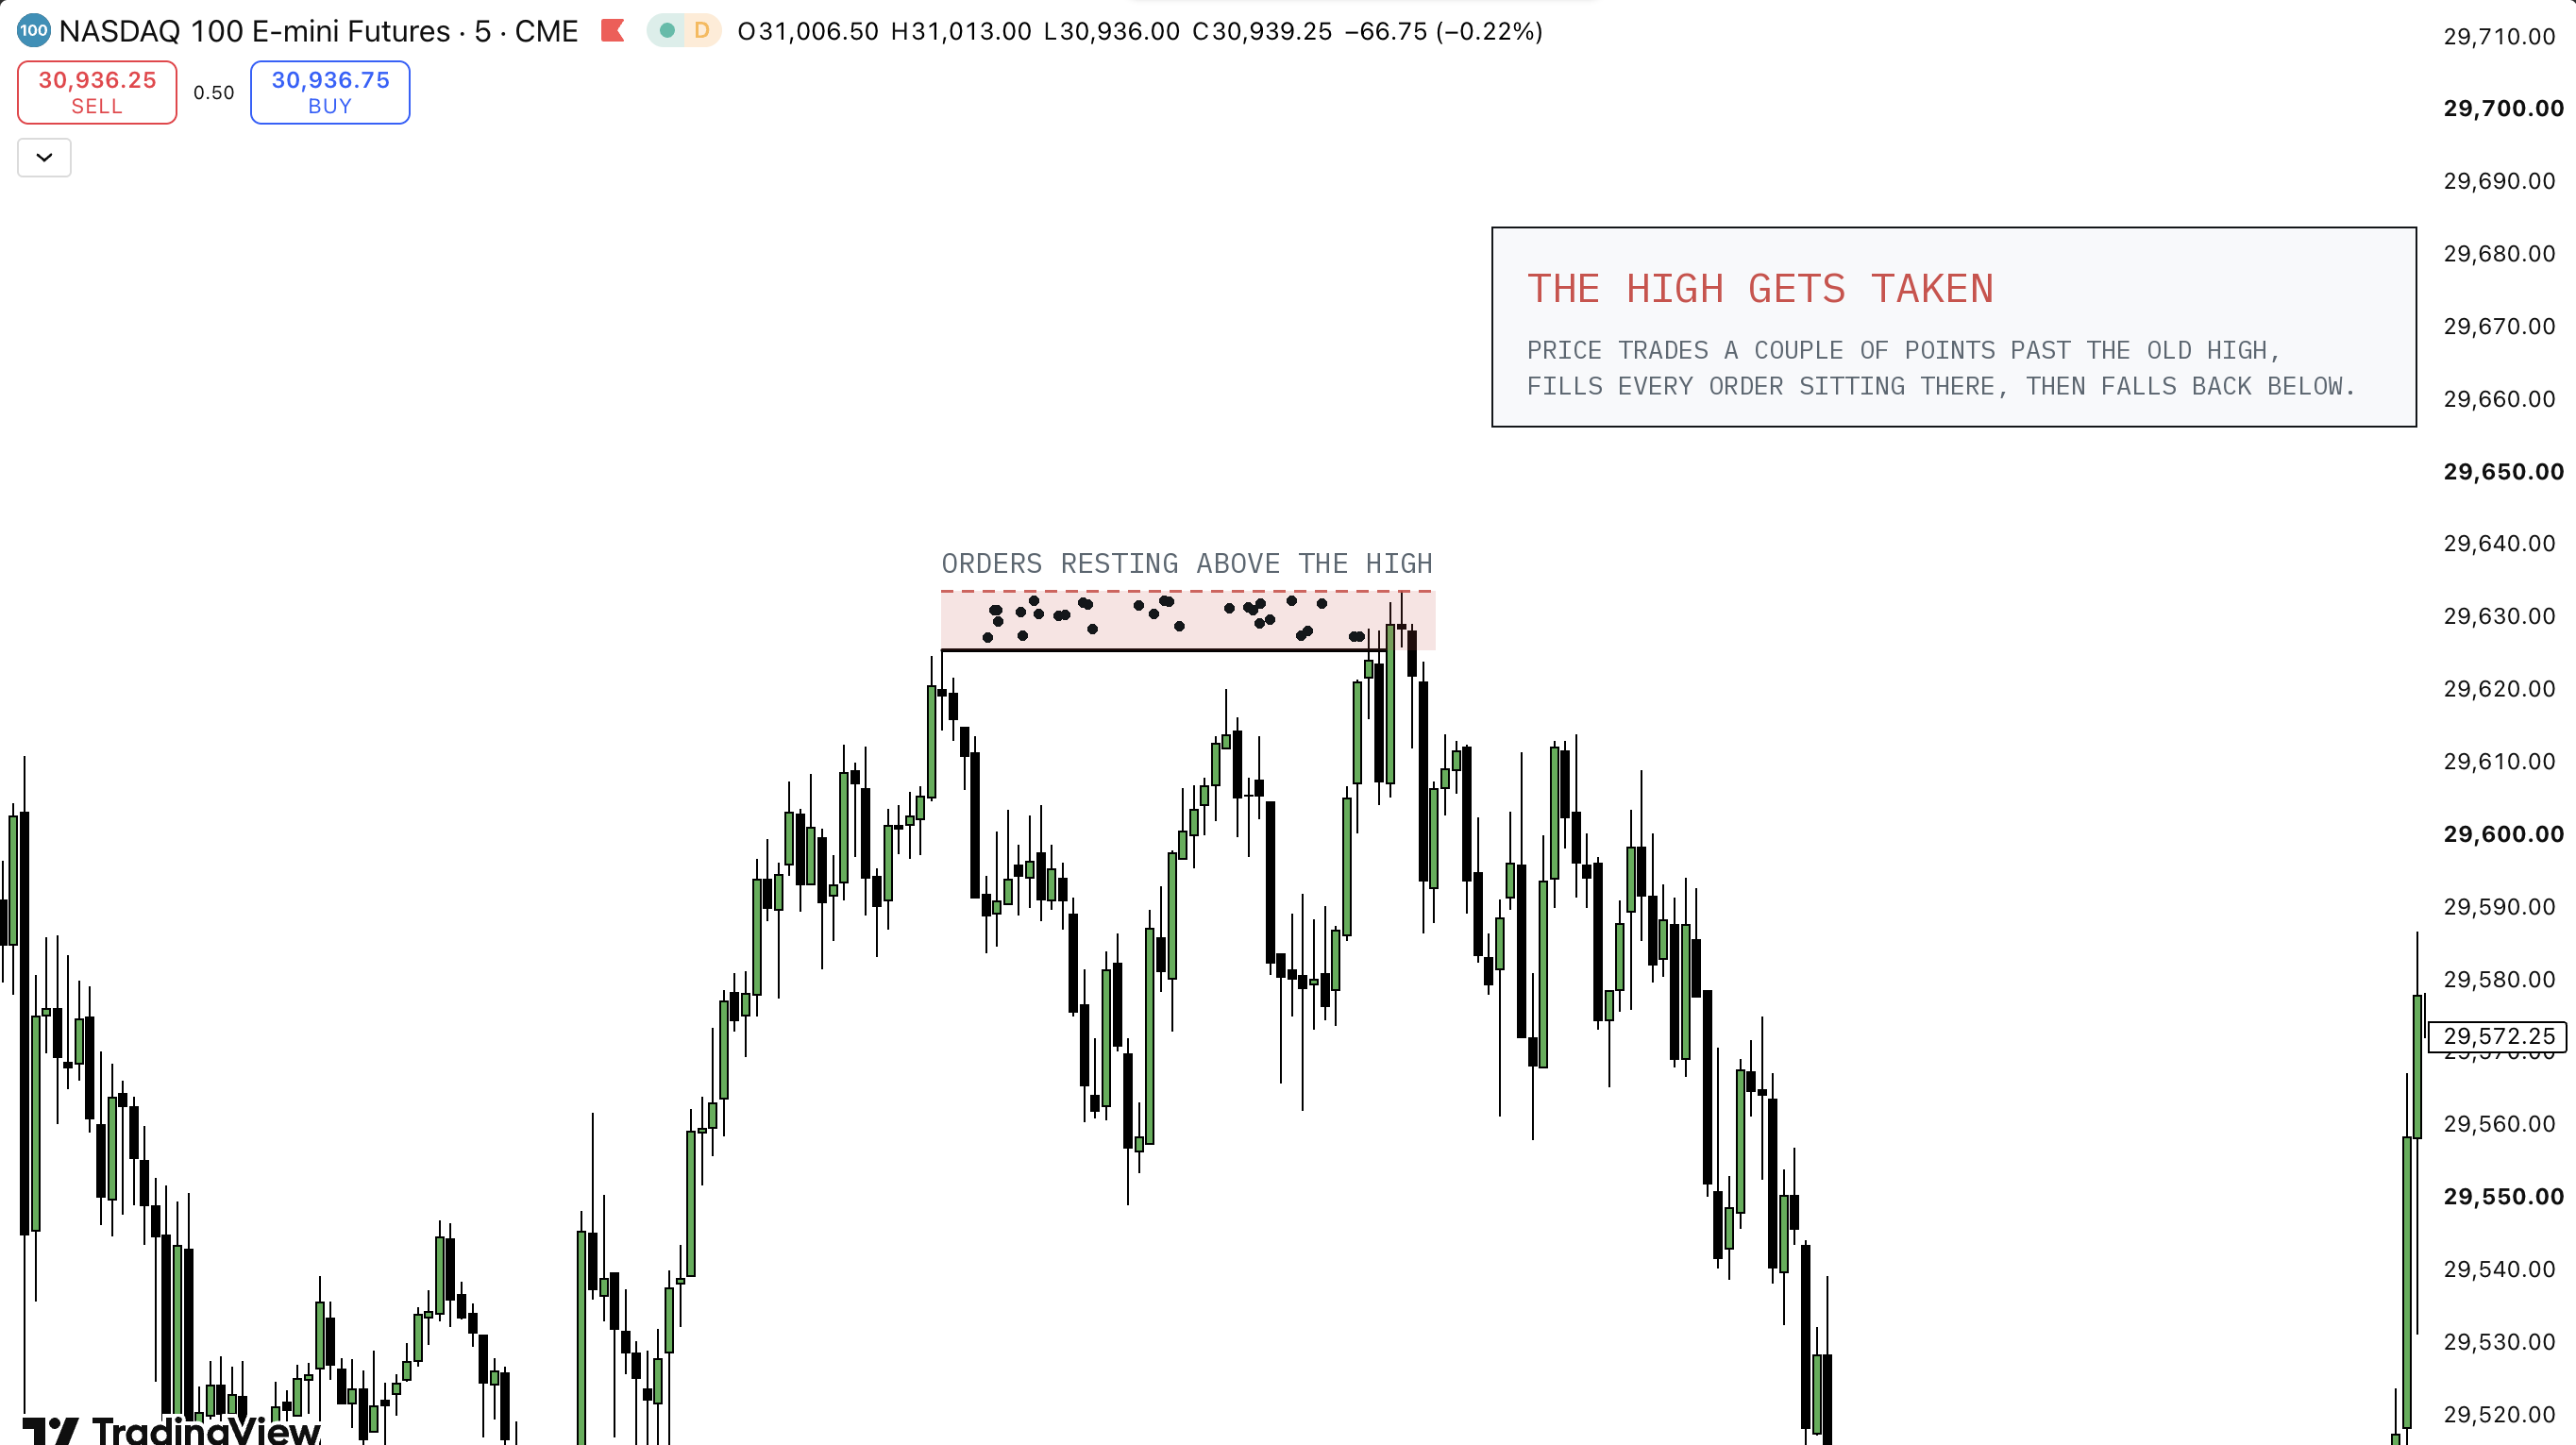
Price makes a high at 29 625 and pulls back. Sellers place their stops just above it, and breakout traders place buy orders there too. Later price rallies back, trades a few points past the high to about 29 633, fills all of those orders, and then falls back below the high, all the way under 29 600. The high was taken, the orders were used, and price moved on. Traders call this taking liquidity.
- Liquidity: resting orders, stop losses and pending entries.
- Buyside: above old highs.
- Sellside: below old lows.
- Price moves to them. At every high or low, ask: taken yet?